
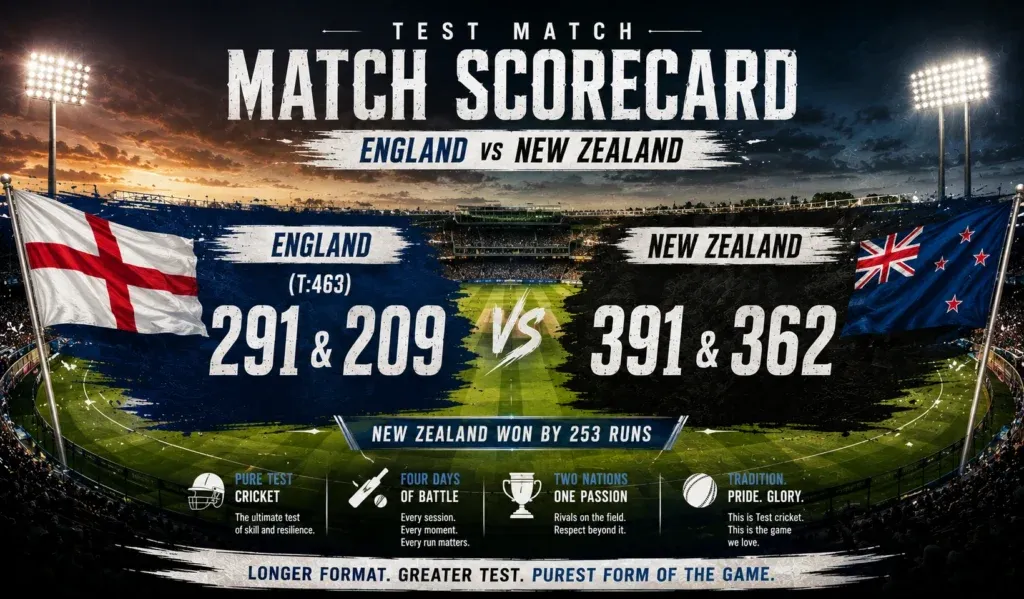
Batting statistics provide useful information about individual cricket performances. cricketmatchteam.com covers cricket scorecards, team details, and match information for readers interested in player contributions. A batter’s score is only one part of the complete picture. Balls faced, boundaries, strike rate, and dismissal details matter too. These figures help explain how an innings developed. They also make comparisons between players more meaningful.
Runs Are Only The Beginning
Runs are the most familiar batting statistic on a scorecard. They show how many runs a batter scored personally. A player making 75 has contributed 75 runs. However, that number does not explain the entire innings. Readers need other figures for better understanding.
A batter may score 75 from 50 deliveries. Another may make the same score from 100 deliveries. Their run totals match, but their scoring speeds differ. The first innings may suit a shorter format. The second may suit a longer match situation. Context changes the meaning of a score.
Runs should also be considered against the match target. A score of 30 may be valuable during a difficult chase. A score of 70 may be less useful if scored too slowly. The team situation matters. Individual statistics need to connect with match conditions.
Balls Faced And Scoring Pace
Balls faced show how many deliveries a batter received. This number helps explain the time spent at the crease. A high score from fewer balls suggests faster scoring. A similar score from more deliveries suggests a slower approach. Both can be useful in different circumstances.
In Test cricket, batters may spend long periods defending. They can face many deliveries without scoring quickly. Their role may involve protecting wickets. In T20 matches, the approach usually changes. Batters have fewer deliveries available.
Balls faced also help calculate strike rate. This is one of the most widely used batting measurements. It helps compare scoring speed. Readers should still consider match conditions. A high strike rate is not always the only objective.
Understanding Batting Strike Rate
Batting strike rate measures runs scored per hundred balls faced. It is usually displayed as a number. A batter scoring 40 from 20 balls has a strike rate of 200. This indicates a fast scoring rate. The calculation provides a simple comparison.
A high strike rate can be useful in T20 cricket. It helps teams build totals quickly. However, losing wickets while attacking can create problems. Batters need to balance risk and scoring. Their role may change during an innings.
In Test cricket, strike rate has a different importance. A player may focus on survival and concentration. A slower scoring rate can be acceptable. In some situations, quick runs may be necessary. The match position determines the approach.
Boundaries And Scoring Patterns
The fours column records how many boundaries a batter hits. A four is awarded when the ball reaches the boundary. The sixes column records balls hit beyond the boundary. These figures show how runs were collected. They help explain the batter’s style.
A player scoring 60 through boundaries may have attacked regularly. Another scoring 60 through singles and twos used different methods. Both contributions increase the total. The approach can influence match momentum. Scorecards provide useful clues.
Boundaries can be especially important in limited overs cricket. They help teams increase scoring rates. However, regular running between wickets remains valuable. Singles keep the scoreboard moving. Twos can turn pressure into opportunities. Balanced scoring often helps teams.
Batting Positions And Roles
Batting positions can influence how statistics should be understood. Opening batters face the new ball. They may deal with fresh bowlers and field restrictions. Middle order players often enter during changing conditions. Lower order players may have fewer opportunities.
An opener scoring 45 can provide a useful start. A number six batter scoring 45 may rescue an innings. Their contributions occur in different situations. The scorecard helps identify batting positions. Match context explains their value.
Some players are selected for specific roles. An anchor may focus on building an innings. An aggressive batter may attack from the beginning. A finisher may score quickly near the end. Statistics should be compared with role expectations.
Not Out And Dismissal Status
A batter can finish an innings without being dismissed. The scorecard usually marks this status as not out. This is important when reviewing batting averages. It also explains why the innings may finish before every player bats. The entry should be read carefully.
Dismissal details explain how an innings ended. Bowled means the ball hit the stumps. Caught means a fielder completed a catch. Run out happens when the batter is outside the crease. Other dismissal types follow specific rules.
Not every dismissal is credited to the bowler. Run outs are one example. Some other dismissals also have different scoring treatment. The scorecard records the official method. Readers should understand these details before judging bowling figures.
Batting Average Explained
Batting average measures runs scored per dismissal. It is calculated by dividing total runs by times dismissed. Not out innings are excluded from the dismissal count. This helps compare long-term batting performance. It is commonly used across cricket formats.
A batter scoring 500 runs in ten dismissals has an average of 50. Another scoring 500 runs in twenty dismissals has an average of 25. The first player has a higher average. The statistic provides a useful comparison. The number of matches should also be considered.
Averages can vary between formats. Test cricket often rewards longer innings. T20 cricket includes different batting expectations. Comparing averages across formats requires caution. Playing roles and match conditions matter. No statistic should be used alone.
Centuries And Half Centuries
A century means a batter scores at least 100 runs. A half century means reaching 50 runs. These milestones are often highlighted in scorecards. They show substantial individual contributions. They can also influence match results.
A century may provide stability during a long innings. It can help a team build a strong total. In limited overs cricket, centuries may involve rapid scoring. The balls faced figure explains the pace. Both numbers provide useful information.
Half centuries are also important. They may come from middle order recovery efforts. A batter can score 50 during a difficult chase. Another may provide a quick contribution near the end. The match situation gives the milestone context.
Partnerships And Individual Scores
Individual batting figures become clearer when compared with partnerships. A batter may score most of the runs during a stand. Their partner may contribute through steady support. The combined partnership can be more important than either score alone.
A player scoring 80 during a partnership of 100 contributed heavily. Another batter added 20 runs. However, extras may also form part of the partnership total. The scorecard may show these details separately. Readers should check the partnership information.
Partnerships can explain how an innings changed. A batter may begin cautiously and accelerate later. Their partner may provide early boundaries. The scoring pattern can shift over time. Partnership details help identify these changes.
Comparing Players Fairly
Comparing batters requires more than checking total runs. Matches played and innings completed matter. Batting positions also influence opportunities. Different formats create different expectations. Conditions can affect performance significantly.
A batter playing many matches may have higher total runs. Another may have a better average from fewer appearances. Both statistics provide different information. Readers should understand what they measure. Fair comparisons use several indicators.
Opposition quality is another factor. Some bowlers are more difficult to face. Certain grounds support particular playing styles. Weather and pitch conditions may change scoring. These factors should be considered during analysis. Raw numbers need context.
Reading Batting Form
Recent scorecards can help readers follow a player’s form. Several innings may show a consistent pattern. A batter might score regularly without making centuries. Another may produce one large innings among several low scores. Recent results provide useful information.
Form should not be judged through one match. Cricket performance naturally changes. A difficult pitch can affect scoring. A strong bowling attack can create problems. Several innings provide a broader view. Longer records are more useful.
Batting form can include technical and tactical details. Scorecards show results rather than every movement. Video and commentary may explain shot selection. Coaches can review additional performance information. Statistics provide a starting point. They do not replace detailed analysis.
Understanding Extras And Batting Totals
Extras are included in the team total. They are not added to individual batting scores. Wides and no balls are common examples. Byes and leg byes can also appear. These figures explain why totals differ.
Suppose the batters score 150 runs together. The extras section may add another 12 runs. The team total becomes 162. Readers should not assign those extras to either batter. The scorecard separates them for accuracy.
Extras can influence close matches. A team giving away too many wides may increase pressure. No balls can provide additional scoring opportunities. Fielding mistakes may also allow extra runs. These details deserve attention during review.
Using Batting Figures In Match Reports
Batting statistics help explain what happened during an innings. A match report can mention the top scorer. It may highlight a quick half century. Partnership information can explain recovery. Strike rate can show scoring pace.
Reports should avoid treating every number as equally important. The match situation determines which performance mattered most. A quick 20 may be decisive during a chase. A patient 90 may be important in Test cricket. Good analysis explains the context.
Readers can use scorecards to verify match reports. They can check individual scores and balls faced. They can review boundaries and dismissal methods. This helps confirm important details. Reliable reporting depends on accurate figures.
Avoiding Common Statistical Mistakes
A frequent mistake is comparing strike rates across formats directly. The expected scoring pace changes between competitions. Test and T20 batting have different demands. Comparisons need appropriate context. Format-specific expectations should be understood.
Another mistake involves ignoring not out innings. Batting average calculations depend on dismissals. A player remaining not out changes the calculation. The scorecard status matters. Readers should check the innings details.
Some readers also focus too heavily on milestones. A century is valuable, but not every century wins matches. A smaller innings can be more important. Team needs should guide evaluation. Statistics work best when connected with results.
Making Batting Scorecards More Useful
A complete batting review combines several scorecard details. Runs show the total contribution. Balls faced explain scoring time. Boundaries reveal how runs were collected. Strike rate indicates scoring speed. Dismissal information explains how the innings ended.
Partnerships and batting positions add further context. Team totals show the overall result. Extras explain additional runs. Match conditions help interpret every figure. These details work together. Readers can develop a much clearer understanding.
Batting statistics are useful for supporters and analysts alike. They help explain individual contributions and team progress. They also make comparisons more meaningful. Careful reading prevents common mistakes. Cricket scorecards become more informative with practice.
Explore cricket batting figures, scorecards, and team performances through cricketmatchteam.com. Keep comparing complete statistics and match situations to understand player contributions more accurately.
Read also :-
pakistan national cricket team vs australian men’s cricket team timeline